Overview
When Timbre Comes Apart was written during 12992-95. The concept for this work is both musical and visual, and the following description will contain information relevant for both aesthetic domains.
Knowledge from the natural sciences paired with computer technology has opened up new perspectives within the arts. It is now relatively easy to use cross-disciplinary mapping to display the same idea; the same data structure in several ways. The construction of this work is one of many possible mappings, and the animation is based on a direct representation of the data structure that comprises the music, one «sees» the music as one hears it. In addition to their art qualities, mappings like this can very well be considered pedagogic as well, as an entry into the current debate about musical representation. With the development of user interfaces that will allow the user to find his or her own visual way through the music, these kinds of mappings would share common borders with the VR field.
Technically, the work has been realized first as music, and the piece was processed through an FFT analysis of the same type used to make sonograms. This was the preferred kind of analysis because of the visual results it yielded. The data set was then structured to make it available to the program used for the creation of the model that was later «filmed», and the result is an experience of flying over/under/through the music as it is being played. The animation was created with help from Roger O. Nordby at the University Center for Information Technology.
Sound
The musical idea for the piece has its basis in the exploration of a set of ratios through synthetic and natural sound. The ratios are derived from an analysis of a bell timbre which is presented in the first 10 seconds, and are used in various ways to structure nearly the whole piece. The first part is realized through synthesis only, and the ratios have been used to generate several «generations» of sine tones. These frequencies have been organized in a variety of combinations and structures, and form the core of the first nine minutes of the piece.
The introduction of natural sound in the middle of the piece makes it difficult to discuss «pure» ratios. The recorded material used is approximately 3.5 seconds, and most of the material stems from a recording 1.25 seconds long. The timbres of the piece are composed without regard for the references imbedded in the recorded material (voice sounds from my at the time 2-year old son, where he toys with language when looking at a screen-saver of the domestic Mac), but with a strictness in relation to the ratios. The processed sounds appear in many layers, where the treatment of each layer has varied according to the ratios. A principal idea has been to «comb» noise-rich sounds, in order to create movement in and out of the (in)harmonic spectrum of the bell presented at the outset of the piece. Several kinds of granulation have been applied, and the numbers determining grain duration and density have been derived from the ratios. There are close to forty such granulations. The effect is most noticeable in the region 10:30 to 11:30, where the sounding timbre slowly changes from a «jumping» quality to a «shimmering» quality.
The noise components are stronger towards the end of the piece, and the «combed» noise sounds come to their conclusion approximately 15 minutes into the piece. The piece slowly disappears with sine tone clusters similar to those heard at the beginning of the work.
An overview would show that the first part of the work is presented as blocks, while in the second half of the piece, the blocks yield to richer spectra with a more detailed and careful balancing of the elements. The music continually refers to earlier developments in the piece, sometimes as direct quotes, sometimes as reinterpretations of the structural idea.
The sounds for this work have been realized and/or processed on Macintosh and Silicon Graphics Indy computers, using various software, as well as a KYMA-system. The programs used were SVP, Soundhack, SoundDesigner II, KYMA, Lemur/LemurEdit for the Mac, and Ceres on the SGIs. The mix was done using Yamaha DMC 1000 mixers, Lexicon Nuverb and Studio Vision sequencer. running on a Mac Quadra 900.
Images
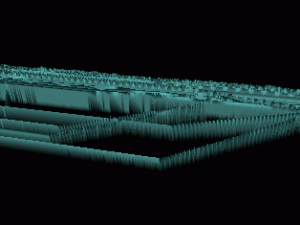
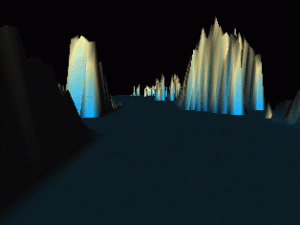
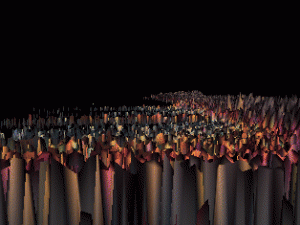
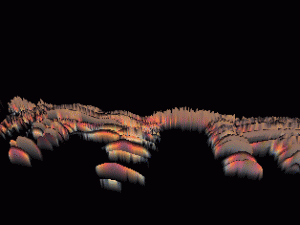
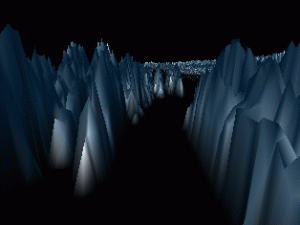
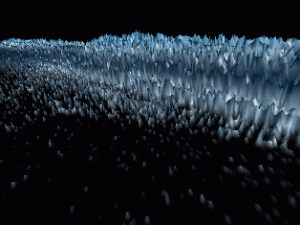
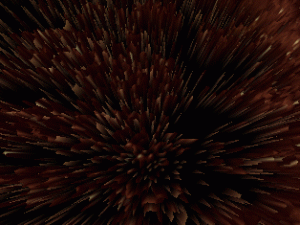
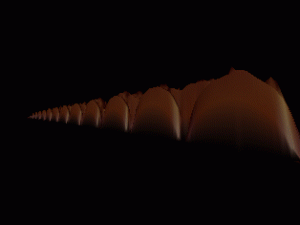
The visual idea, as mentioned in the beginning of this document, was based on using the data set from an FFT analysis. An FFT analysis provides data on the frequency components present in every moment of a sound. This data set was considered as a sonogram; a two-dimensional representation of time, frequency and amplitude. The camera was moved along the time-axis in the sonogram, and the «altitudes» in the «landscape» show amplitude variation. Several curves were drawn in manually to describe the camera placement in the spectrum and the height over the spectrum. Notation also included camera angle, focus and which characteristics the material in the model should have. A model of the data set was created in the program Explorer on a Silicon Graphics Indigo II, and the material quality as well as lighting and lighting angle was set there. A number of small C-programs were written to generate the splines needed for smooth camera movement. The images, 25/sec, were shot onto a SONY CRV-disk, and transferred to Betamax tapes for the final sync/mix with the music.
The movement and focus of the camera was set with the intention of augmenting the musical development, either by focusing on the strong sounding parts of the spectra, or by showing connecting elements. It was important to never have the camera work against the music, and at times the camera would reveal what was to come. It can be argued that this kind of preparation takes something away from the experience of the temporality, but this sort of expectation is very similar to what we encounter in verbal communication, where grammar and word categories form the foundation for pattern recognition. Since part of the project idea was pedagogic, it seemed appropriate to occasionally «reveal» the energy disposition of the piece. Also, when the musical development is minimal, as in the first 3 1/2 minutes, the camera moves very slowly to avoid creating any kind of «excitement» in a material that is otherwise composed with a focus on stillness (but not quiet).
The camera movement over/under the model is designed to display the illusion of the data set, to explicate the abstraction of the idea, and to disassociate any notion of a fly-by-nature experience. The same applies to the sudden zoom effects and the swift change of perspectives that occur in two or three places.
The images could not have existed without the music in this video, but they are not to be considered as some sort of subset. It seems natural to say that the images and the music are reciprocal explanations of each other.
All pictures © Jøran Rudi.
Not to be used for publication without permission.
